

Marketers test every aspect of their campaigns to determine what’s working, and what’s not working.
A/B testing is great for quick, simple decisions, especially when the decision is being made by one person and in a digital medium.
This kind of actionable insight, however, is much more difficult to obtain when you’re trying to understand a complex B2B sale.
These selection decisions can take anywhere from three to eighteen months, involve twenty or more people on the buying team, and multiple touch-points (including demos, calls, emails, in-person meetings, and a POV or POC).
Which aspects of the offering and buying experience are helping drive sales? And which aspects are hindering sales? This is what enterprise and mid-market software companies struggle to understand.
That’s where good win/loss analysis reports come into play.
What is a Win/Loss Analysis Report?
A win/loss analysis report should quickly and effectively detail which elements of your offering and buying experience are driving wins and losses and then explain why with quotes from your actual buyers.
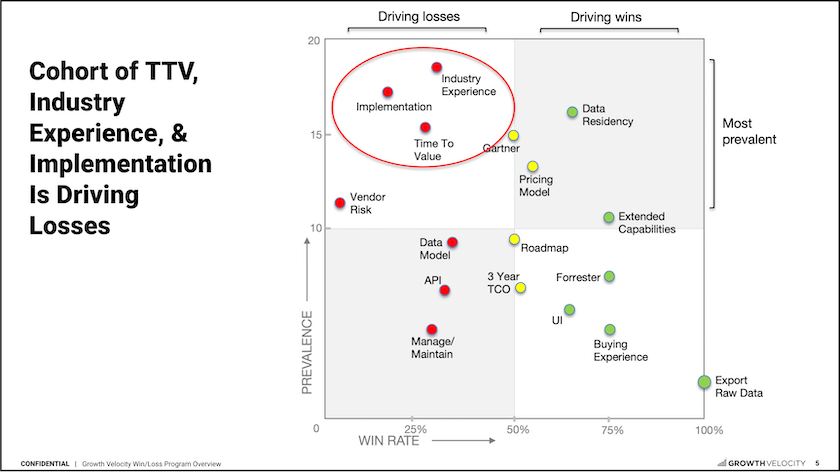
A chart like the one below quickly illustrates the key drivers of your wins and losses. Decision criteria are plotted by win rate, so we know whether they’re driving sales or costing us sales. And on the y-axis we see how prevalent of a concern the individual factors are.
By looking at every aspect of your business as a key component on a win/loss report, you can gain clarity into your market’s buying decisions that you wouldn’t have otherwise.
You may have been absolutely sure, for example, that your pricing was causing losses after a new competitor entered the market with a penetration pricing strategy. After a win/loss analysis, however, you may discover that buyers really left because they preferred the customized demos, or that their sales team was more responsive. The price was just an added bonus, so changing your pricing to match would only cost you revenue.
How Are Win/Loss Reports Created?
Win/loss reports are created using data collected from interviews or surveys of recent buyers about decisions they’ve made for your product. The decisions made by buyers in won deals are compared to decisions made by buyers in lost deals.
In most cases, the focus is on late-stage losses. That being said, interviewing or surveying early-stage losses provides valuable insight into the buyer’s initial experience with you, like their perceptions of both earned and owned media or the buyer experience during discovery sales calls and demos. Early stage loss interviews also provide more complete intelligence on the direct and indirect competitors that beat you.
We interview buyers for at least thirty minutes to really understand which factors play a part in that decision-making process, for better or worse. And because we’re talking to buyers from your sales opportunities, it means we’re looking at your ideal customer profile and not just the market overall. You’ll be getting information that can help you win every high-value member of your target market.
Three Things You’ll Learn From a Win/Loss Analysis Report
There are three types of actionable insight you can really only get through an accurate and detailed win/loss report. Let’s take a look at all three.
1. A Clear View of What’s Driving Wins and Losses
One of the most challenging aspects of win/loss reporting is determining which findings are significant. Which patterns deserve discussion with your stakeholders, and which do not?
Each interview can easily produce a ten or more page transcript, packed with useful details. Stakeholders, however, have other things to do, and they ultimately just need to know which factors are the biggest drivers of wins or losses.
We recommend prioritizing decision drivers by their prevalence, win rate, and linkage with other factors.
-
- Prevalence. We can extrapolate from frequency in the buyer interviews. The more frequently a decision driver is cited, the more deals it is likely influencing in general. We prioritize items in the top two quartiles.
- Win rate. Very few decision drivers are associated only with wins, or only with losses. This is why the same item can show up in both a “top reasons we win” and “top reasons we lose” list. We calculate the win rate for each decision driver. This allows us to report its influence on a continuum from strongly negative to strongly positive (0-100%).
- Cohorts. In a complex sale, no one criterion determines the outcome. So we analyze decision criteria as cohorts. This approach gives us a more accurate understanding of how individual criteria combine to drive wins and losses.
By analyzing these three dimensions we can confidently highlight the factors that are most impacting buying decisions.
Let’s look at the sample win/loss analysis report below.

Items in the top two cells are the most prevalent decision drivers.
But we get a different view on their potency with win rate data. “Extended Capabilities” has a strongly positive influence on outcomes. And “Vendor Risk” has a strongly negative influence. These two factors are having an outsized impact on some deals. By contrast, “Gartner” and “Pricing Model” have a neutral impact on outcomes. Even though they’re much more prevalent, we should consider making them a lower priority.
Overall, “Data Residency” is the leading positive influence on closed deals. Knowing this, you may be tempted not to make changes. But in this situation our advice was don’t rest on your laurels. Broad data residency support was the strongest positive influence this company had. Without this strong positive influence — say a competitor were to catch up on this capability — this vendor would have a much harder time winning deals.
2. Getting the “Why” Behind The Decision-Driving Factors
Win/loss analysis reports shouldn’t just give you a list of decision-driving factors; they should also explain the why behind them.
Why are those criteria so important to your buyers, and what do they need to see?
Which competitor or vendor did they assess was best on each factor, and why?
And which competitors or vendors did they consider to be the worst?
We cluster this feedback together to create themes or dimensions in our reporting. This allows sales, marketing, and product teams to focus on issues that will impact the most buying decisions.
When, for example, implementation came up as a negative decision factor (as it did above), some of the underlying themes included:
-
- Availability of experienced systems integrators
- The time it takes to see value (TTV)
- Industry experience
There’s no guesswork involved here; a proper win/loss analysis will dive deep into actual buyers’ decision processes to really understand what’s causing them to purchase (or not).
3. Concrete, Unbiased Recommendations
Third-party win/loss services provide a fresh perspective. We come in with experience but no biases; we have no horse in the race except to get you accurate information about your buyers and their buying journeys.
As an expert 3d party, a win/loss service fosters a solution focus among teams of critical thinkers. Your teams will be more likely to accept the results than if someone from your internal sales, marketing, product, legal, or even leadership teams had put the reports together.
Win/loss consultants are also able to leverage experience gained in roles like yours. And they can advise on how other clients resolved similar problems. What fixes they tried and what worked for them.
We’re Switzerland, and everyone on your team knows that. You can trust our recommendations, which are concrete, definitive, and neutral.
Final Thoughts: What to Look for in a Win/Loss Report Service
When choosing a win/loss service, the reporting they offer is a key deliverable to focus on.
Pay careful attention when selecting a service. Use the following questions to compare vendors and choose the best service for you:
-
- Will the vendor’s standard reporting be convincing, concise, and detailed enough for your executives and/or stakeholders?
- What do clients of the service see as the pros and cons of the vendor’s reporting?
- Will the vendor customize the reports? Are there additional fees for customization?
- Will the vendor provide recommendations in addition to the findings about win/loss drivers?
- Does the service provide a shareout of the findings and recommendations for your team?
- Does the service summarize each interview to keep you in the loop on what’s been learned? And if so, can your team provide feedback to adjust the interview topics if necessary?
- Can the vendor provide your team with searchable, direct access to interview transcripts and summaries?
- Can the vendor provide less detailed reporting for some users, and more detailed reporting for others? Feedback on sales team performance is a common use case here.
Growth Velocity provides each client with their own win/loss portal to access all the data we collect, while also reporting what it all means and recommending what to do next.
Want to learn more about what makes us different? Get in touch with us here.
Related Posts

Sales Win Loss Analysis: Why Data-Driven Leaders Are Leveling Up
Sales win loss analysis helps leaders make data-driven decisions. What’s working and where can we double-down? What isn’t working, and how do we fix it?

Three Reasons Sales Leaders Want Even More Data About Their Buyers
While B2B sales teams are literally swimming in data, it’s not enough. Data-driven sales leaders are using input directly from buyers to find new ways to improve win rate and lead with conviction.

Data Driven Targeting And Messaging Increases Profitability
Sales and marketing are typically the largest area of spend for an expansion stage company. Marketing leaders can support increased profitability by reassessing who the strongest buyers are, and developing innovative and data driven ways to target them.