

How To Conduct A Win/Loss Analysis
In this “How To” guide, I describe the seven-step process we’ve developed for making Win/Loss Analysis more efficient and impactful.
We use win loss interviews as our data source for this process. But there are many sources of Win/Loss Analysis data including CRM reason codes, sales team interviews, and buyer surveys. You can optimize both the accuracy and efficiency of your win/loss program by using both qualitative and quantitative data sources.
First things first, we define Win/Loss Analysis as an inductive methodology for identifying and understanding the issues that cause deals to be won or lost. Win/Loss Analysis provides a novel and objective assessment of the issues and opportunities in a business’s go-to-market strategy.
Win/Loss Analysis Can Make A Big Impact Through Continuous Improvements
In today’s fast moving markets, Win/Loss Analysis can’t be one and done.
Your program needs to be continuous.
The graphic below shows how agile and lean techniques—like Build-Measure-Learn—can be applied to your Win/Loss Analysis.
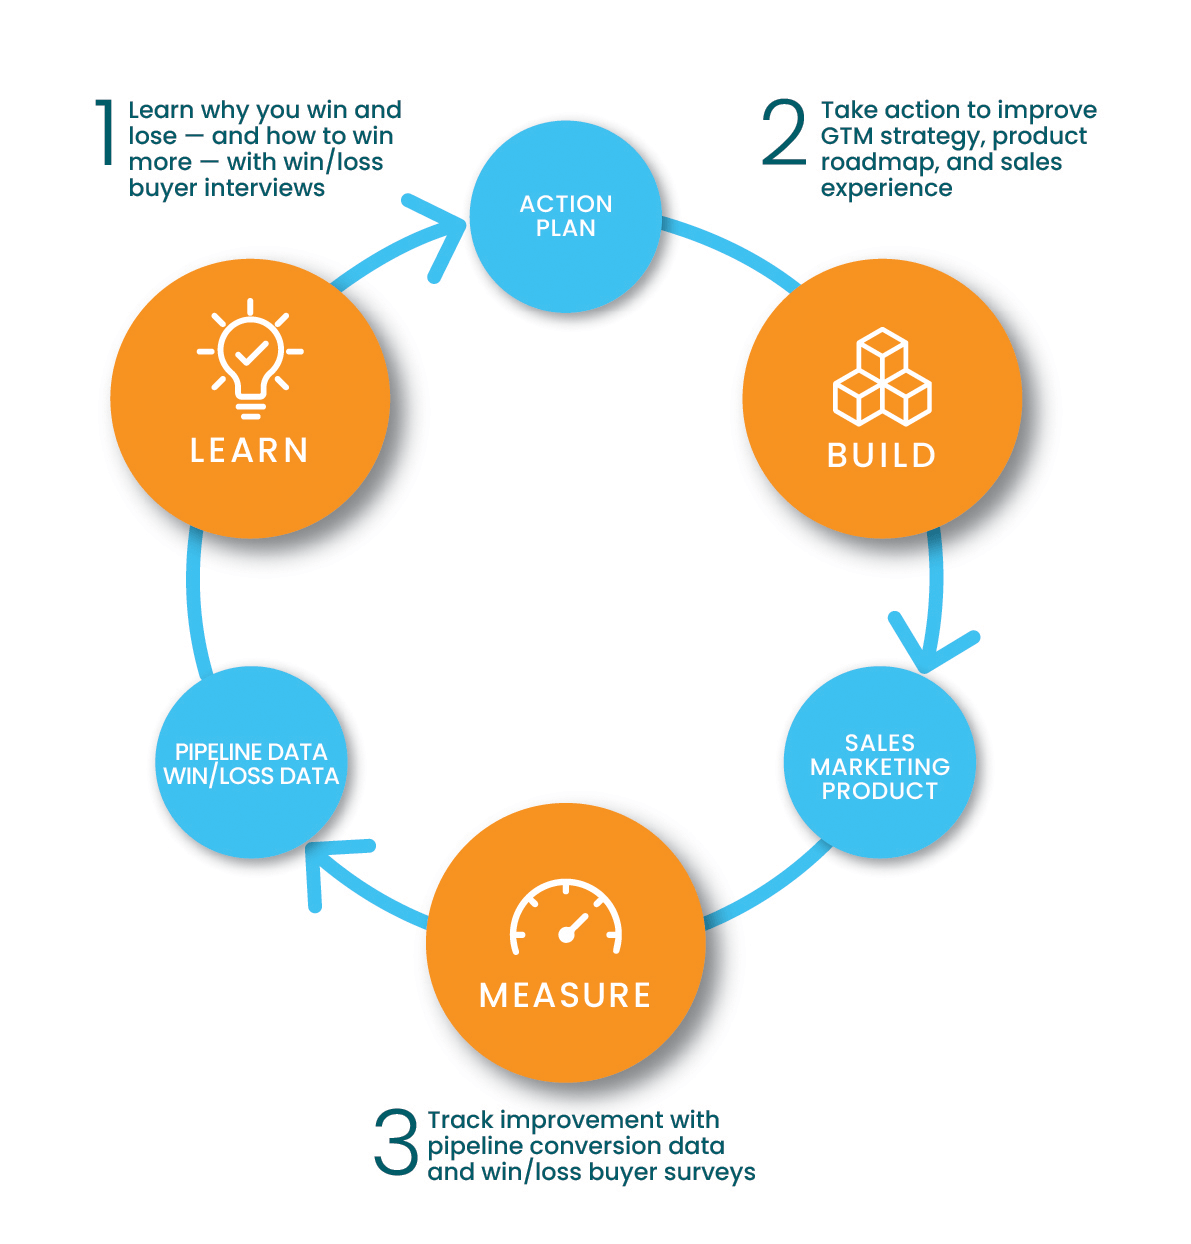
Small, continuous improvements can have a large compound impact. Toyota and other Kaizen practitioners have proven this.
Win/Loss Analysis: Our Seven-Step Process
The rest of this “How to” guide describes the seven-step process we use ourselves in our Win/Loss Analysis service. We’ve iterated this approach through years of in-the-trenches experience.
Step 1. Set A Goal And Socialize It
Start with the business case for your Win/Loss Analysis. This can be formal or informal, depending on your organization’s culture.
In a Gartner study of win/loss programs, Todd Berkowitz summarized the impact this way:
A formal and rigorous win-loss analysis program enables better segmentation, product strategy choices, and sales enablement .. those that take a more comprehensive approach have seen up to 50% improvement in win rates.
Anecdotally, I’ve found an organization’s size influences its goal for Win/Loss Analysis.
At many smaller companies, the goals for Win/Loss Analysis are specific and measurable. Increase win rate. Shorten sales cycles. Improve marketing efficiency. I find larger companies have a different goal. They want to make more data-driven decisions. Win/Loss Analysis helps them do that.
Step 2. Make A Plan
Win/Loss Analysis moves through three phases: buyer outreach, buyer interviews, and analysis and reporting.
Use the decision points below to plan how much time you’ll need for each phase, and whose participation you’ll need.
-
- Outputs. Do you want to provide an intensive analysis of win-loss drivers and recommendations based on a large group of buyer interviews? Or will your outputs be lighter weight and delivered continuously? This continuous delivery model is common when your use case is improved CI or sales execution.
- Interview cadence. For an intensive analysis, you’ll want to complete the buyer interviews in two to three weeks. For CI or sales coaching, you’ll interview buyers continuously. Five interviews per quarter is a typical cadence for CI purposes.
- Number of interviews. We recommend a sample size for Win/Loss Analysis of at least twenty buyer interviews. That’s 10 Closed/Won opportunities and 10 Closed/Lost opportunities. A smaller sample size of 5 or even 10 interviews puts you at risk of onesie-twosie type comparisons between the losses and wins.
- Stakeholders. The most common users of win/loss findings are sales, product marketing, and product management. For buyer outreach, you’ll need a strong relationship with sales operations and sales reps.
- Buying decision. The developers who purchase Google’s BigQuery are making a very different decision than the business users who choose Google Workspace. Likewise, mid-market and enterprise buyers have different selection criteria and decision making processes. Don’t inadvertently combine different buying decisions into one analysis.
Step 3. Set Up Your Interview Pipeline
Buyer outreach is the riskiest and most time consuming phase of Win/Loss Analysis.
I hear that buyer participation rates can be as low as 10% for consultants who specialize in Win/Loss Analysis.
There are many reasons for this. Inboxes are overflowing. Sales has bigger priorities than helping you connect with buyers. And for buyers, especially in losses, there’s little benefit to spending the time with you.
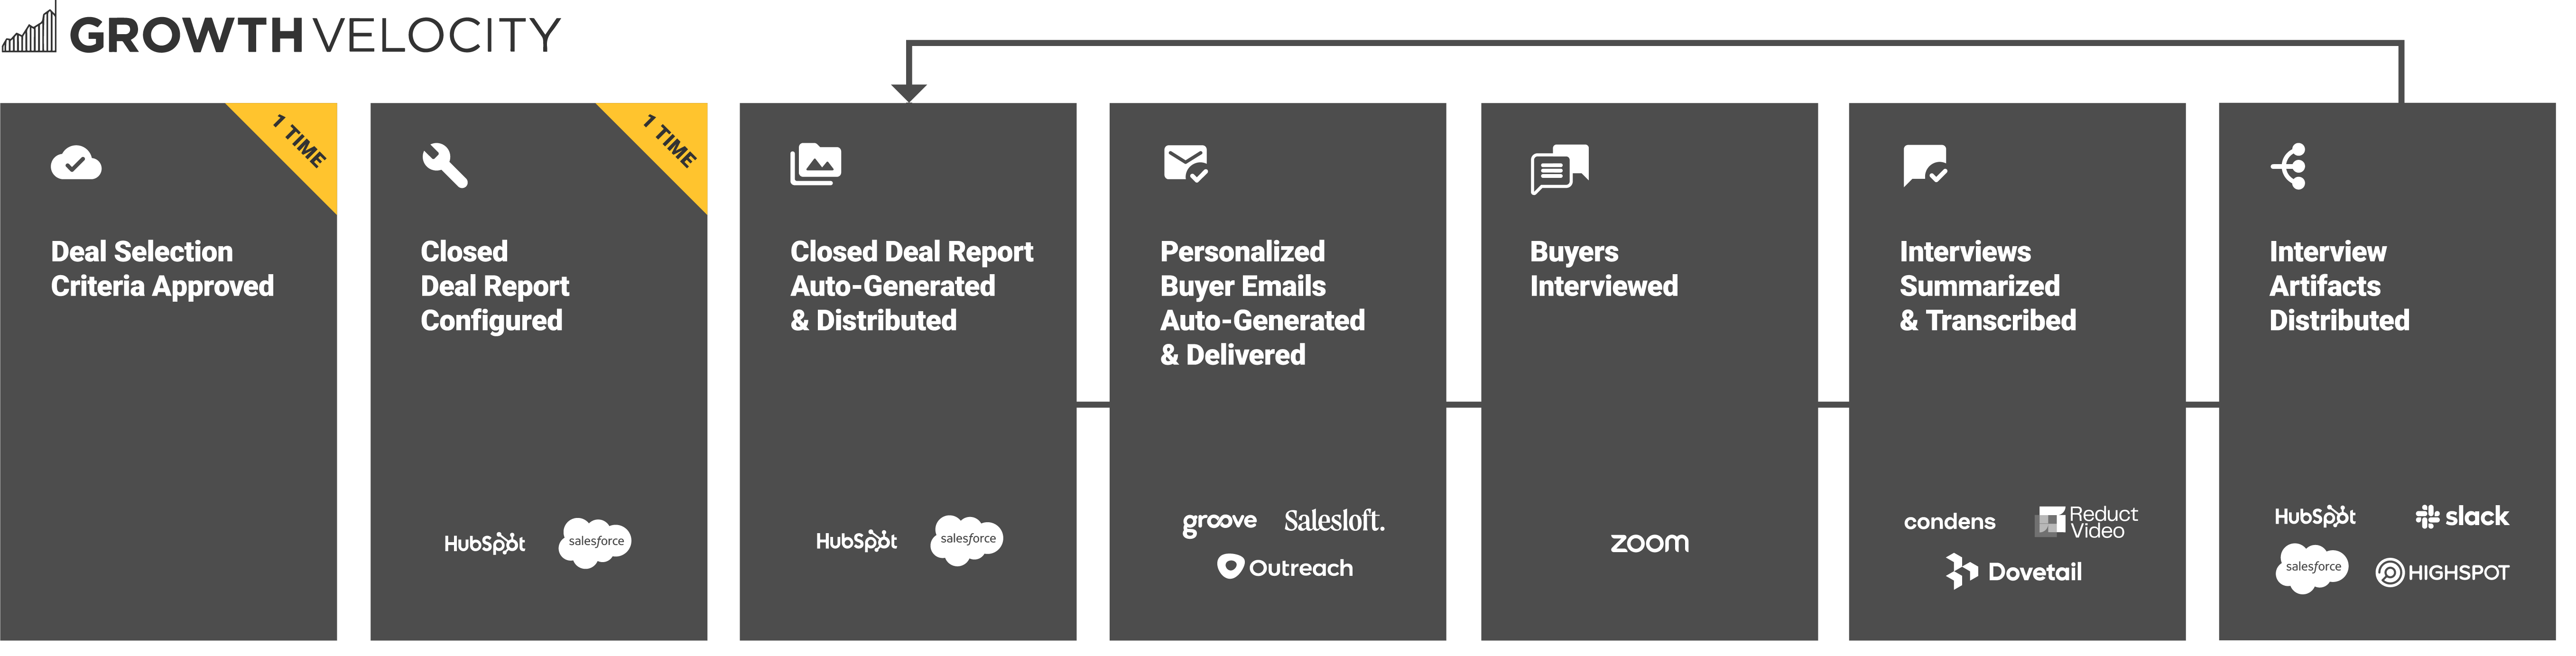
Check our post on Win/Loss Analysis software to see how you can automate these steps.
You can improve participation rates by being savvy about your outreach. Consider these factors as you set up your interview pipeline:
-
- Automate reporting. It’s easy to automatically generate a daily report of closed opportunities that meet your criteria. For example, net new opportunities that Closed/Lost at Stage 4 (Proposal) or Stage 5 (Negotiation) or Closed/Won. Watch a Salesforce video showing how to do this here.
- Sales review. Build trust with sales by giving their leadership time to review the deal report before you begin outreach. This is especially important in the first weeks of your program. This is a step that can be omitted later, when you’ve developed their trust.
- Don’t wait. Begin the outreach process the same day the deal is reported to you. Participation rates on both won and lost opportunities will be lower if you wait a week or two to reach out.
- Losses first. Start your outreach with the more time-consuming Closed/Lost deals. Switch over to the wins once you’ve contacted all your losses.
- Copy and paste. Participation rates are higher when the request comes from the AE on the account. This is especially true for complex sales. AEs will be more responsive to your request when you send them everything they need (ie greeting, subject line, body text). Then they just copy and paste into a new email.
- Automate outreach. You can automate buyer outreach with the sales engagement software (eg Outreach, Salesloft, Groove) that you already have. This is especially valuable once your win/loss program is up and running and you want to expand it. You may want to interview a new cohort of buyers each quarter, or expand to cover other products.
Step 4. Interview Buyers
There’s a tradeoff between interview length and response rate. I’ve found response rates are highest when I request a 25-minute interview, but that requires a tight delivery. Put all your questions into an interview script, then time it, and refine.
This is another benefit of focusing on a specific dropoff point in the pipeline. The interview can zoom in on the critical points in a month-long buying journey. For example, if you’re concerned that sales execution is causing lost opportunities, you can omit discussion of perceptions and influences early in the journey (e.g., a Gartner magic quadrant report).
As you prepare your interview questions, here are four tips to keep in mind:
-
- Best-Worst Scaling can be a very helpful tool for putting in context the answers to “What did you like most/least” questions. After that question has been answered, follow by asking which vendor was best for that issue and which was worst.
- Why and how are incredibly valuable follow-ups. Your ability to take action—to know how something needs to be improved—lies in the answer to those questions.
- Understand that buying usually begins rationally and ends emotionally. That is, buying teams will be thoughtful about their needs and criteria as they work towards a short list of vendors. Then, unless one vendor’s offering is clearly superior on those criteria, the final decision will be made on emotional factors.
- Look for ways to make it easier for your buyer to cue memories. Using a documentary film metaphor helps here. Doing so makes it more likely you’ll get the real story rather than something made up in the moment.
Summarize each interview as soon as you finish and while it’s fresh in your mind. You’ll get each interview transcribed, but you’re likely to be the only person who reads the transcript from beginning to end.
We begin each half-page summary report with a “Quick take” that captures the key takeaways in roughly 50 words. This is followed by a bulleted list of other important feedback. We Slack the report to our core internal team so we can discuss and adjust in real time.
AI transcription of win/loss interviews can be one-tenth the cost and 96% faster than traditional human transcription. We compared two human-based transcription services and four AI-powered ones in summer 2023. In our test, AI won. We posted our test results and recommendations here.
Step 5. Analyze The Win/Loss Data and Report Your Findings
Coding or tagging is the first step in analyzing the interviews. You’ll want to code each buyer’s responses to the questions you asked. So, for example, you’ll tag each of the decision criteria they used. Or each of the sticking points in the buying process.
The quick and free way to do this is with a spreadsheet. Alternatively, you can invest in specialized software like MAXQDA, which has been the default choice for analyzing qualitative data. But, many new SaaS options have emerged such as Condens, Dovetail, and EnjoyHQ.
I prioritize each issue by its prevalence and win rate, and use this to categorize each into a matrix, Gartner Magic Quadrant style.

For example, in this win/loss quadrant we’ve plotted the most prevalent selection criteria on the four quadrants. Win rate is on the x-axis, and prevalence is on the y-axis.
-
- Criteria in the right two quadrants are strengths for this vendor. These four criteria are how this vendor is truly differentiated, as judged by buyers who are voting with their money.
- And the criteria in the left two quadrants are weaknesses—across all buying contexts, all competitors—and they are ultimately the main reasons this vendor wins and loses.
- In the upper righthand cell, these criteria are driving wins. These should take a front and center role in the vendor’s positioning.
- In the top lefthand cell, these three criteria are driving losses. They’re feature deficits. They make it onto many buyers’ lists and should be fixed.
Check “Win/Loss Analysis Reports: 3 Things You’ll Learn” to see what a great win/loss report looks like.
Step 6. Align to Act
A read out of your win/loss findings is necessary but not sufficient.
You should engage a cross-functional team of stakeholders in absorbing and understanding the buyer feedback and planning for action.
For this purpose, consider running a “buyer workshop” using Affinity Diagramming.
We also use Affinity Diagramming to generate a prioritized list of fixes and improvements during our onsite at a project’s conclusion. We record these items in a draft action plan.
The workshop is also a good time to present your plan for measuring the program’s impact.
Step 7. Measure Results
Measure the impact of your Win/Loss Analysis, but don’t use next quarter’s win rate to do it.
Go-to-market performance is influenced by the changes you make based on the Win/Loss Analysis, and many other factors. Latency is another reason you shouldn’t use next quarter’s win rate to measure the impact of your win/loss. It will likely require 2+ quarters for an impact to be measurable as leads and opportunities move through the pipeline.
Consider these ways to measure the program’s impact:
-
- Retrospective. Use a focus question like “How has decision making changed since we began our win/loss program?” to get stakeholder feedback on the program’s impact. Incorporate this affinity diagramming exercise into a meeting 1-2 months after your first win/loss readout.
- Internal survey. This can be as simple as asking “How would you rate the quality of our internal decision making?” and providing a 10 point Likert scale for answers. Take an “after” reading when sufficient time has passed and compare to the “before” measurement.
- Pipeline or funnel metric. Take the “after” reading of your chosen metric when a cohort of opportunities influenced by the Win/Loss Analysis have closed. Incorporate a focus question into a stakeholder meeting to understand how much of the change is attributable to the Win/Loss Analysis.
Conclusion And What’s Next?
We’ve now made a complete loop through the Build-Measure-Learn cycle.
We began by using Win/Loss Analysis to Learn how to fix the biggest dropoff point in your pipeline. Then, after analyzing the data and developing an action plan, you and your cross-functional team Built improvements. And then you Measured the results.
Now, consider applying your experience with Win/Loss Analysis to further improve your target metric.
Or – tackle a new issue or opportunity.
A good first step is to identify a critical dropoff point in your pipeline. Pull data about how your pipeline is actually performing, analyze it, and identify the critical dropoff points.
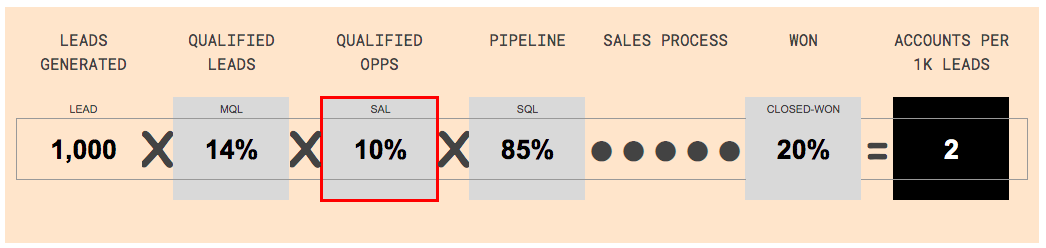
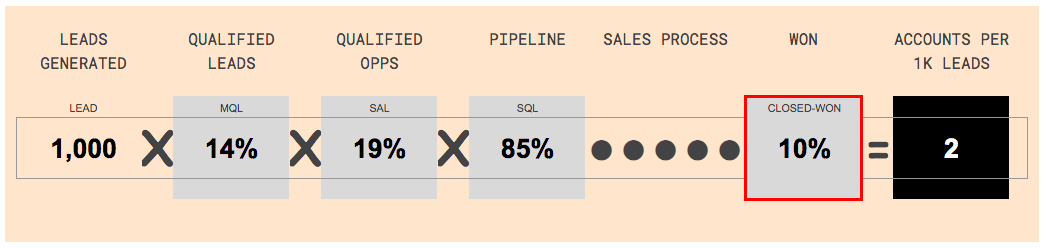
You’ll get the biggest benefit from your next Win/Loss Analysis when you use your own conversion data to identify and fix the biggest dropoff point—not a lower priority issue.
Related Resources
Win/Loss Analysis Templates – A Buyer’s Guide
We’ve studied dozens of templates for Win/Loss Analysis to help you quickly find the one that meets your needs.
Architecting A Win/Loss Program To Meet Your Goals
Win/Loss programs have a lifecycle of their own. The Win/Loss Lifecycle is a useful framework for thinking about your options and deciding what kind of program you need.