I want to introduce you to the Demand Gen Priority Matrix, a valuable tool for improving pipeline quality and coverage.
The Matrix enables demand generation to reallocate resources — increasing investment in the most prevalent, highest win rate buying contexts, and reducing investment in lower ROI buying contexts.
Win/Loss Analysis provides the foundation for the Matrix, with data-driven insights about the fit between a vendor’s value proposition and the buying contexts or dissatisfiers in a vendor’s pipeline.
When I say Value Prop Fit, what I mean is that a vendor’s value proposition fits or suits a specific buying context. The degree of fit is measured by buyer behavior, such as pipeline prevalence and win rate. When I say buying context, I mean the original situation that triggered a buyer to engage in a buying process with a vendor. What was the problem or opportunity to do better that made the buyer dissatisfied with her current situation?
Using The Demand Gen Priority Matrix
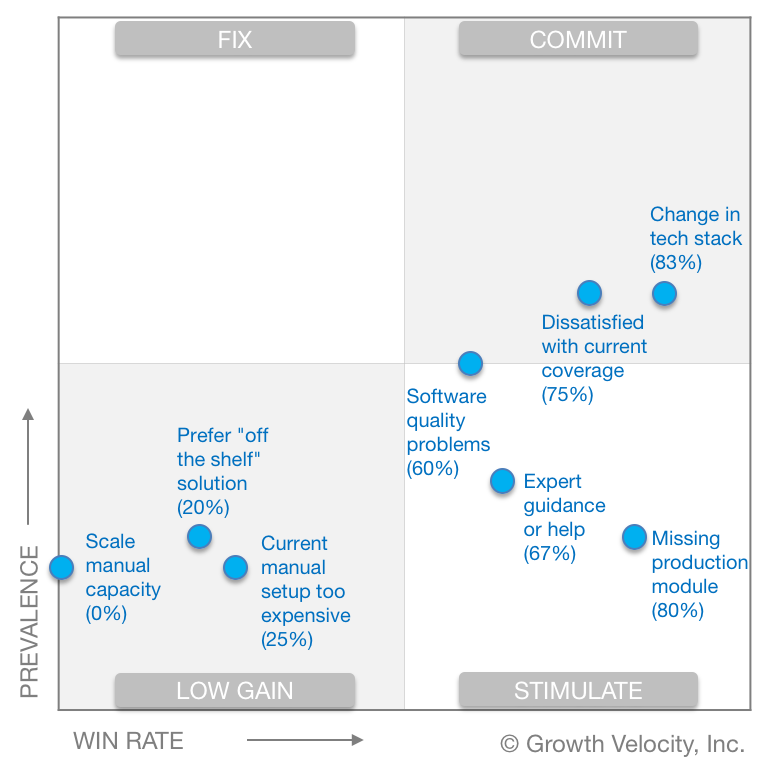
The Demand Gen Priority Matrix below (based on blinded, aggregate data from Win/Loss Analyses performed by Growth Velocity) plots buying contexts by their win rate (on the x-axis) and prevalence (on the y-axis).
Prevalence, on the y-axis, is the number of buyers who included that trigger in their answer. We interviewed 20 buyers for this study, so the y-axis range is 0 to 20.
Win rate, on the x-axis, ranges from 0 to 100%.

Growth Velocity uses the Demand Gen Priority Matrix to help clients improve decision-making about building pipeline.
- In the top right hand quadrant — “Change in tech stack” and “Dissatisfaction with current coverage” — these are this vendor’s most prevalent buying contexts with the highest win rates. These are high volume, high quality lead generators. Our guidance is Commit resources to demand gen campaigns that combine relevant messages with technographic data to reach prospects who’d recently made tech stack changes.
- In the bottom right, these are high win rate buying contexts, but they’re less prevalent. So our guidance is Stimulate. How can this vendor make more prospects aware of its capacity to help when they have “Software quality problems” or need “Expert guidance or help.”
- In the lower left quadrant — “Scale manual capacity,” “Current manual setup too expensive”, and “Prefer off the shelf solution” — there’s low buyer engagement on these buying contexts, and this vendor’s win rate is low when buyers do engage. I wouldn’t expend any outbound effort to attract these Low Gain buyers, and consider qualifying them out or using account scoring to de-prioritize them if they do engage.
Weak Value Prop Fit Makes It Harder To Generate Pipeline
We’ve found weak Value Prop Fit makes it harder to generate pipeline in both new and current target markets.
Teams that are over-delivering — shooting to triple revenue next year (instead of doubling it) — enter a new segment with a value prop that doesn’t fit the buying context and struggle to fill the top of the funnel.
For other teams — even when no changes had been made to go-to-market strategy — pipeline coverage and quality were eroded by changing market conditions. Buying contexts recede, new ones emerge, and competitors evolve. In these cases, outdated buyer personas and ICP definitions made demand gen’s messaging and targeting less effective.
The Express Lane To Better Pipeline
While pipeline is also improved with better competitive positioning, product differentiation, and sales execution — all of which are insights provided by Win/Loss Analysis — the Matrix enables faster improvements with fewer dependencies.
We’re fans of the Demand Gen Priority Matrix because it requires no changes to value proposition or any other aspect of a vendor’s offering to quickly improve pipeline coverage and quality. Win/Loss Analysis makes this possible by collecting qualitative data about the buying contexts in the pipeline, and quantitative data about their prevalence and win rate.
Related Posts
Sales Win Loss Analysis: Why Data-Driven Leaders Are Leveling Up
Sales win loss analysis helps leaders make data-driven decisions. What’s working and where can we double-down? What isn’t working, and how do we fix it?
Win/Loss Analysis Reports: 3 Things You’ll Learn
Which aspects of your product offering and buying experience are helping drive sales? And which aspects are hindering sales? This is what enterprise and mid-market software companies often struggle to understand. A good win/loss analysis report will provide the answers to these questions.
Three Reasons Sales Leaders Want Even More Data About Their Buyers
While B2B sales teams are literally swimming in data, it’s not enough. Data-driven sales leaders are using input directly from buyers to find new ways to improve win rate and lead with conviction.


